To learn how to use Report Writer's advanced features, such as Pivot Tables and Field Expressions, please click here.
How to view an existing Report
- Navigate to Report > Report Writer.
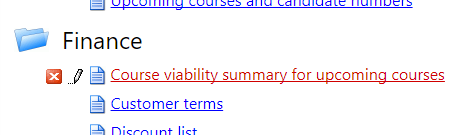
- Click on the name of the Report that you are interested in viewing:
- You will be taken directly to the Report where you can change the Filters of your report (such as adjusting a date range) and export your Report in a variety of formats (such as csv or xls).
How to export a Report
- Navigate to Report > Report Writer.
- Click on the name of the Report that you wish to export.
- After the Report loads, select whichever of the exporting formats you wish the export to take.

- Your Report will then download in your browser in your chosen format.
How to save a Report
- Within your Report, click Save or Save As.

- If you click Save As, you'll need to select or create a category for it to go into. Give the Report a name and then select the category from the drop down box.

How to edit existing Reports
- Navigate to Report > Report Writer.
- Click the Design icon next to the Report that you are interested in editing.
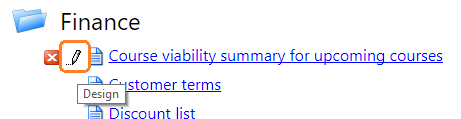
- Clicking this button will take you to the Fields step of the Report Writer.
- Here, you can remove, add, or edit the Columns displayed in your Report.
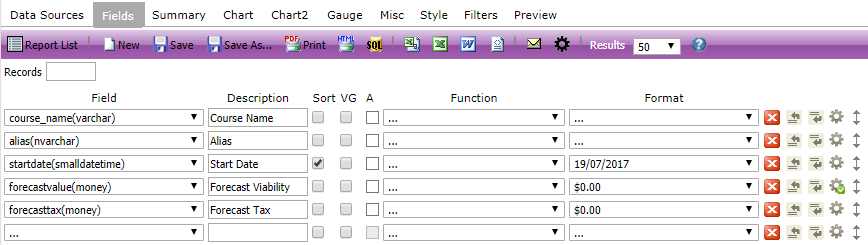
- From this page, you can access each stage of the Report Writer to make any changes such as adding additional Filters, or adding an extra Data Source by using the tabs along the top of the page. Select Preview to view any changes that you make.

- Once you have made your changes, you can then Save As to keep the original Report and create your own version.
- Please bear in mind that any changes you make will only be saved if you click Save or Save As before leaving the Report.
How to add Data Sources and build relationships in a Report
- Navigate to Report > Report Writer.
- Click the Design icon next to the Report that you wish to add Data Sources to, or to create a new Report, click Design a New Report link at the top of the page.
- Select the Data Source from the drop down. When selecting your first Data Source, it's best to think what you want your Report to be about and choose the Data Source which best represents this.

- To add a nother Data Source, click either the up or down arrow to add the Data Source above or below the existing Data Source. To remove a Data Source, click the red X.

- To create a relationship between the Data Sources, select one of your existing Data Sources from the drop-down menu. Then, map these Data Sources together by choosing the same values within the values drop down. Make sure that these values correspond, otherwise your Report will either error, or display the wrong information.
- Click Save or Save As to save your Report.
How to add and format Fields
- To add a new Field into the Report, click the drop down box. You will be presented with a list of available Fields for your Report based on the Data Sources you selected in the previous step.

- To add additional fields, click either the up or down arrows to add the field above or below the existing field. To remove a field, click the red X. You can move your fields by dragging and dropping them.
- To Sort, Visually Group, or perform an arithmatic function on the Report, select the relevant box.

- If you wish to add functions to your fields, select these from the drop downs under Function.

- To see how your Report looks, click the Preview button at any time.
- Click Save or Save As to save your Report.
How to add a Pivot to your Report
- Below the Field selection area you will see a series of buttons. To create a Pivot in your Report, click Add Pivot.

- Within the pivot options, you need to select the Field which you are creating Columns for and the Field which will be populating within the resulting grid.


- In the above example, we have used the Delegate status Field from the ap_userscoursescalendar_view to create Columns, and then filled the cell values with the number of Delegates with that status.
- In the below example, we are reporting on the number of course dates which happen per year, per course.
- To create this Pivot, select the course name as a normal Field, then open up a Pivot. Select the start date for your Columns. Group this by year, and add a count on the unique identifier for course dates (coursecalid) to fill the Report.


How to use the Summary tab
- To add a summary to the Report, navigate to the Summary tab.
- Add the fields you wish the Report to summerise in the same way you would a standard field.

- These fields will then appear at the top of your Report summerising the data.
How to add Charts to your Report
- To add a chart to your Report, navigate to the Chart tab.
- Select the type of chart you wish to create from the drop-down menu.

- Add the field you wish to group the results by to the Label field, and the field you wish to display the results of into the Value field.

- Add your functions, and choose the format you wish the Value to display in.
- Click Preview to see your chart.

How to add Titles, Headers, Footers, and Descriptions to your Report
- Navigate to the Miscellaneous tab within your Report.
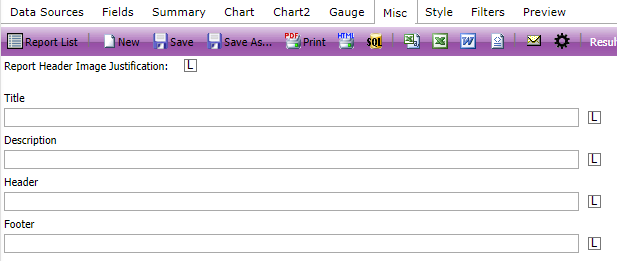
- Enter the text into the relevant box. You can then choose how to align the text by clicking the box to the left of the text box. You have three options for aligning your text:
L: left
M: middle
R: right
How to schedule Reports for sending
- To automatically email reports out from the system, use the Settings at the bottom of the Miscellaneous page.
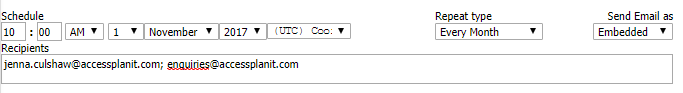
- Set the Schedule date as the next date you wish for the Report to be sent, i.e. tomorrow. This date needs to be in the future.
- Select your Repeat type; there are various options here including every weekday, every week and every quarter.
- Select the format of which you would like to Report to be sent.
- Finally, enter the email address of the recipients of the Report.
- Please note that any email address entered above will receive the Report in the selected format. It does not matter if the Report is not shared.
How to add Filters to your Report
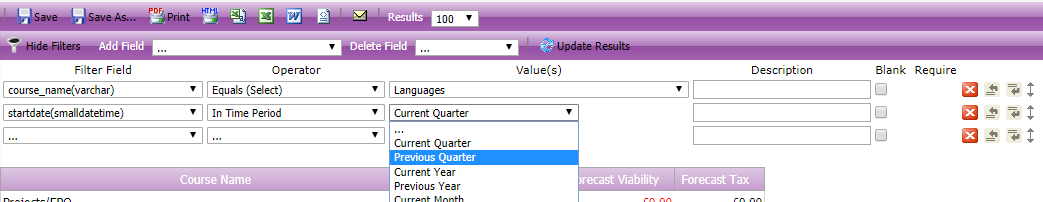
- Navigate to the Filters tab.
- Select the field you wish to add the filter for from the drop-down.

- Choose your Operator, and any Values you wish to filter on.

- Add any filter rules to the Filter Logic box.

How do I add a Custom Field into a report?
The correct data sources to use for the different types of custom fields are below:
User fields - users
Course Date fields - coursescalendar
Course Template fields - coursescompanies
Delegate fields - userscoursescalendar
Invoice fields - invoices
- Opportunities - opportunities