| Live Search | ||||||||
|---|---|---|---|---|---|---|---|---|
|
The Dashboard is the initial home screen that you see when you log into your accessplanit system platform and can be fully customisablecustomised, either with predefined Gadgets already within the systemplatform, or with ones that you can build yourself. Dashboards can be used as a central reporting tool, and if your role encompasses several functions within the business, can be set up so that you can switch between with multiple different Dashboards with ease.
To learn how to build Dashboards, click here.
| Widget Connector | ||
|---|---|---|
|
To learn how to build Dashboards for other Users in the systemplatform, click here.
Available Gadgets
Your accessplanit system platform offers a wide range of Gadgets for you to display on your Dashboard. Below is an overview of what each Gadget can be used for:
DataGrid Gadget
The Datagrid DataGrid Dashboard Gadget is an incredibly useful feature which allows you to display tables from any module in your system platform on your Dashboard. You can then apply filters to these tables, which will allow you to tailor the information that they display.
Developer Gadget
The Developer Information Dashboard Gadget provides useful information to developers about your systemplatform.
HTML Gadget
The HTML Dashboard Gadget allows you to add videos, images, and custom text into your Dashboard, which can be useful for displaying company-specific information to other Users.
Image Gadget
The Image Dashboard Gadget allows you to add images to your Dashboard to personalise your systemplatform.
Login Statistic Gadget
The Login Statistics Dashboard Gadget allows you to see User log-in numbers over different periods of time.
Report Gadget
If you have the Report Writer module available on your systemplatform, this Gadget will allow you to display any of your reports on your Dashboard.
RSS Gadget
The Rich Site Sample (RSS) Feed Dashboard Gadget allows you to display an RSS feed on your Dashboard. The RSS Feed can be used to deliver regularly changing web content to your systemplatform, such as news feeds or blog posts.
My Skills Profile Gadget
The My Skills Profile Dashboard Gadget allows you to select a skills profile and its associated awards to display on your Dashboard.
Statistic Gadget
The Statistic Dashboard Gadget allows you to display basic statistical data on your Dashboard.
Summary Gadget
The Summary Dashboard Gadget allows you to display key information in the form of a summary table of your Dashboard.
Trainer Calendar Gadget
The Trainers Calendar Dashboard Gadget allows Trainers to view their personal Trainer Calendars, allowing to keep track of their upcoming courses.
Web Page Gadget
The Web Dashboard Gadget allows you to display a web page. This can be an external web page, or one from within your systemplatform.
Welcome Message Gadget
The Welcome Message Dashboard Gadget displays a welcome message, alongside the date and time you last logged in.
Suggested Dashboards
There are a couple of useful Dashboards that you might wish to set up for your Users. Below are some instructions on how to configure these Dashboards:
Course CoordinatorAdmin Dashboard
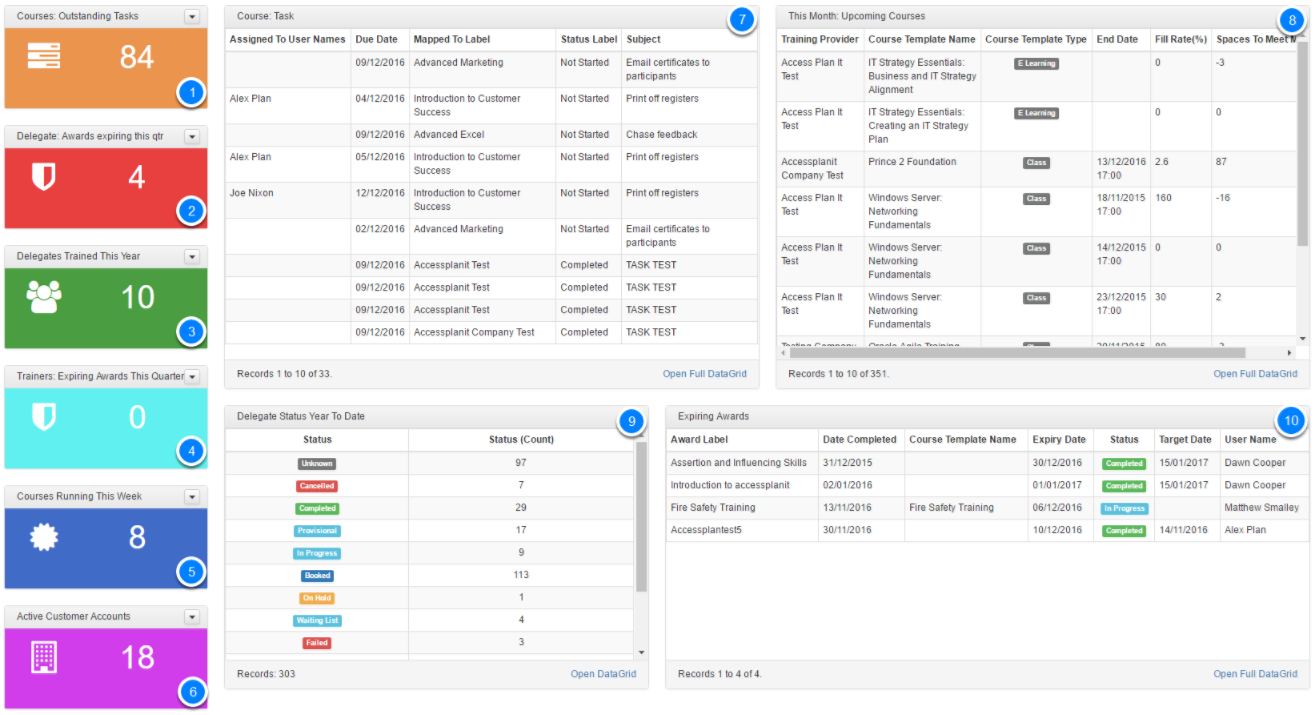
1. OUTSTANDING TASKS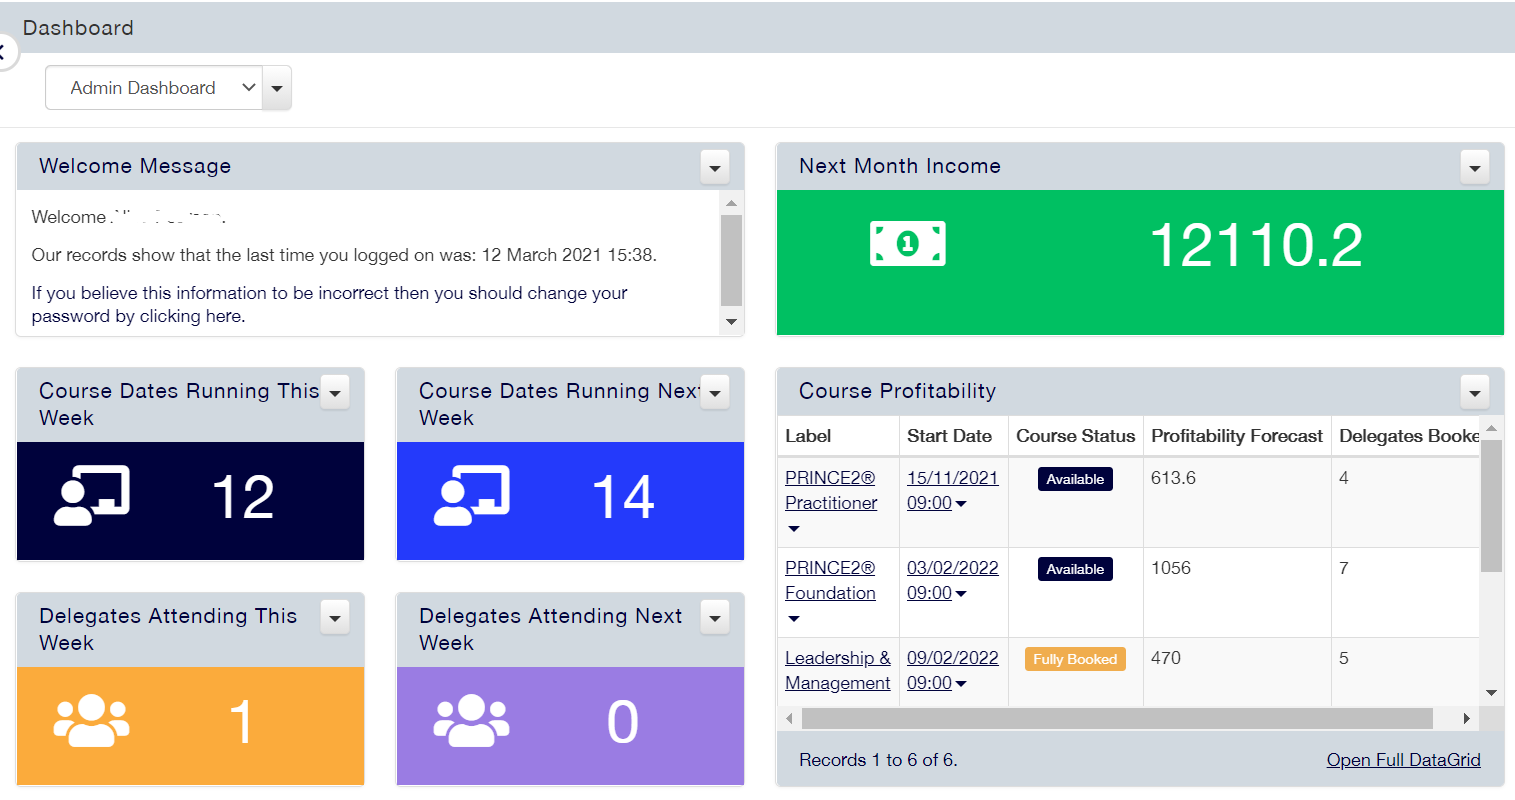
Next Month Income - Add a 'Statistic' gadget > Choose the 'TaskCourse Date' module > Aggregate by the 'CountIncome' > Filter field by 'Status ID', 'Is Not In', 'Completed'2. EXPIRING AWARDSSum'
Course Dates Running This Week - Add a 'Statistic' gadget > Choose the 'User AwardCourse Date' module > Aggregate by 'Count' > Filter by 'Expiry Start Date', 'Period', 'Next Ninety Days'3. UPCOMING COURSES - Add This Week'
Course Dates Running Next Week - Add a 'Statistic' gadget > Choose the 'Course Date' module > Aggregate by 'Count' > Filter by 'Start Date', 'Period', 'Next Seven DaysWeek'4. DELEGATE TRAINED THIS YEAR
Course Profitability - Add a 'StatisticDataGrid' gadget > Choose the 'User' module > Aggregate by 'Count' > Filter by 'Latest Course Attended', 'Period', Last Year'5. ACTIVE CUSTOMER ACCOUNTSInclude the Label, Start Date, Course Status, Profitability Forecast and Delegates Booked columns
Delegates Attending This Week - Add a 'Statistic' gadget > Choose the 'CompanyDelegate' module > Aggregate by 'Count' > Filter by 'Active EmployeesStart Date', ' Greater ThanPeriod', '0This Week'
6. EXPIRING AWARDS (TRAINERS)Delegates Attending Next Week - Add a 'Statistic' gadget > Choose the 'AwardDelegate' module > Aggregate by 'Count' > Filter by 'Expiry DataStart Date', 'Period', 'Next Ninety Days'
7. TASKS DUE THIS MONTH- Add a 'DataGrid' gadget > Choose the 'Task' module > Choose the columns to be displayed > Filter by 'Due Date', 'Period', 'This Month'
8. UPCOMING COURSES- Add a 'DataGrid' gadget - Choose the 'Course Date' module > Choose the columns to be displayed > Filter by 'Start Date', 'Period', 'Next 30 Days'
9. DELEGATE STATUS- Add a 'SummaryWeek'
Manager Dashboard
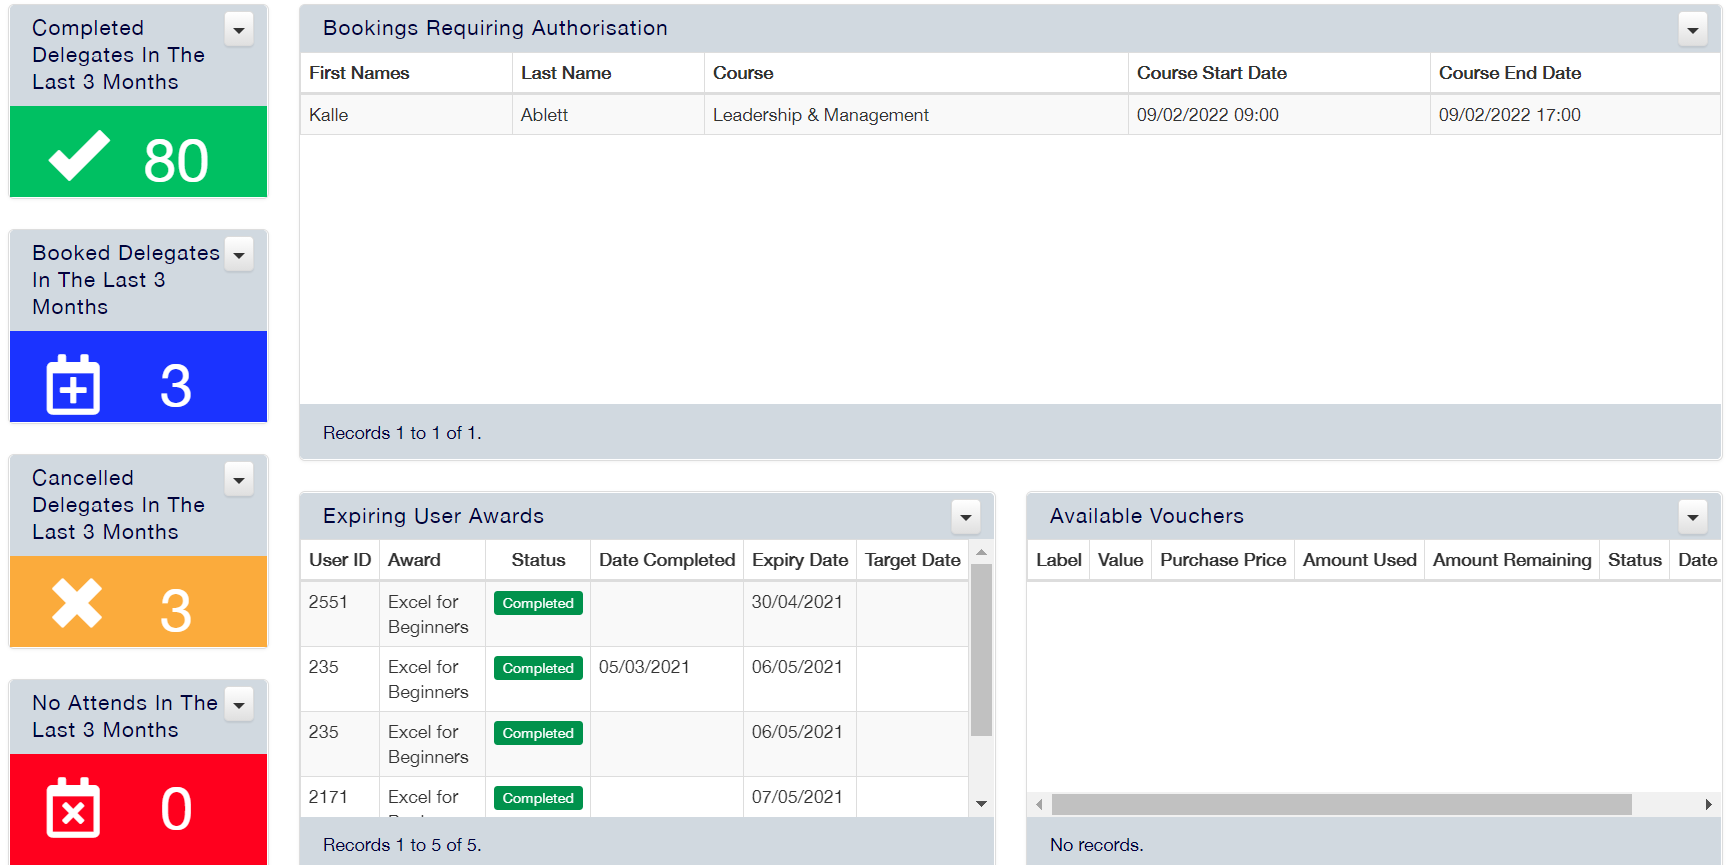
Completed Delegates In The Last 3 Months - Add a 'Statistic' gadget > Choose the 'User CourseDelegate (Manager Access)' module > Choose 'Status' in the column, then 'Group By' > Add another column to display > Choose 'Status' again, then Aggregate by 'Count' > Filter by the period you wish to see
10. EXPIRING AWARDS- Choose a 'DataGrid' gadget > Choose the 'User Award' module > Choose the columns you wish to display > Filter by 'Expiry Date', 'Period', 'Next Ninety Days'
Sales Dashboard
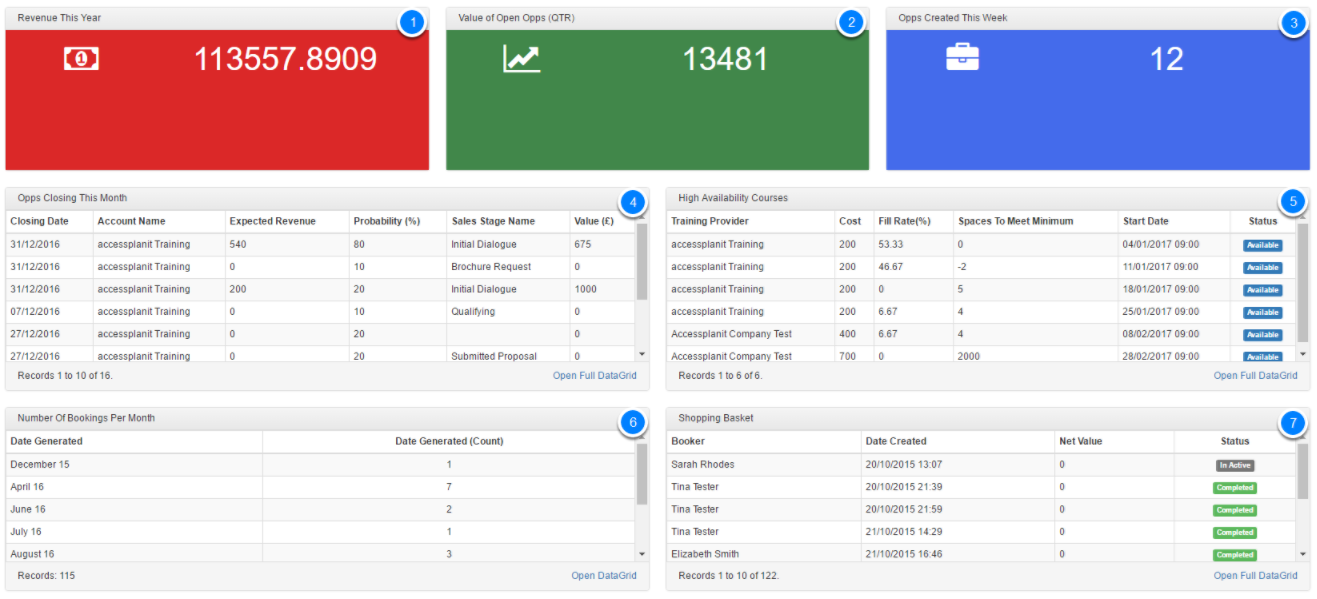
1. REVENUE THIS YEAR - Add 'Status Is In Completed'
Booked Delegates In The Last 3 Months - Add a 'Statistic' gadget > Choose the 'InvoiceDelegate (Manager Access)' module > Aggregate by 'Sum' > Select 'Amount' from the column option Count' > Filter by 'Date Due', 'Period', 'This Year'2. VALUE OF OPEN OPPORTUNITIES - Add Status Is In Booked'
Cancelled Delegates In The Last 3 Months - Add a 'Statistic' gadget > Choose the 'OpportunityDelegate (Manager Access)' module > Aggregate by 'Sum' > Choose 'Expected Revenue' from the column option Count' > Filter by 'Closing Date', Period', 'This Quarter'3. OPPORTUNITIES CREATED THIS WEEK - Add Status Is In Cancelled'
No Attends In The Last 3 Months - Add a 'Statistic' gadget > Choose the 'OpportunityDelegate (Manager Access)' module > Aggregate by 'Count' > Filter by 'Date Created', 'Period', 'Last Seven days'4. OPPORTUNITIES CLOSING THIS MONTHStatus Is In No Attend'
Bookings Requiring Authorisation - Add a 'DataGrid' gadget > Choose > Choose the 'OpportunityDelegate Authorisations (Manager Access)' module > Select the columns you wish to display > Filter by 'Closing Date', 'Period', 'This Month'5. HIGH AVAILABILITY COURSES- Add Include the First Name, Last Name, Course, Start Date and End Date columns
Expiring User Awards - Add a 'DataGrid' gadget > Choose > Choose the 'Course DateUser Award (Manager Access)' module > Select the columns you wish to display > Filter by 'Fill Rate', 'Is Less Than', '80'
6. BOOKINGS PER MONTH - Add a 'Summary' gadget > Choose the 'Course Date Bookings' module > Select 'Booking Date' then 'Group By' > Select 'Booking Date' again, then 'Count'
7. SHOPPING BASKET- Include the User ID, Award, Status, Date Completed, Expiry Date columns > Filter by 'Expiry Date Period Next 3 Months'
Available Vouchers - Add a 'DataGrid' gadget > Choose > Choose the 'Shopping BasketVouchers (Manager Access)' module > Select the columns you wish to display > Filter by 'Date Created', 'Period', 'Last Seven DaysInclude the Label, Value, Purchase Price, Amount Used, Amount Remaining, Status, Date Created columns > Filter by 'Status Is In Unused, Part Used'